

 Once you get your funnel up and you're getting traffic, there are some big questions to ask yourself.
- Am I profitable?
- What's my goal?
- How do I know when my funnel or ads are working?
This is where funnel KPI’s comes in. There are key performance indicators and these can vary depending on your funnel, traffic, and exactly what your marketing goals are.
My main goal with pay per click Facebook ads is to reach what I call a break-even point on the front end. I want to advertise for opt-ins., and then after the opt-ins, potential customers see an offer or a series of offers.
Make it Break-Even
I want that process to be break-even. Every dollar I spend, I get that dollar back. I don't really care if I'm profitable. I just want to break even.
My customers have a significant lifetime value (Yes you can increase the value of your customers).
Once they're on my customer list, I know the odds of them purchasing more go up significantly in the coming weeks and months. If I can create a break-even upfront funnel I can essentially buy all the traffic I want.
Get Every Dollar, Every Day, Back in Your Pocket
Every dollar I spend, every day, goes right back into my pocket. That same day I'm net out-of-pocket zero and I'm growing my customer and prospect lists. The best things in life are free. If you have a break-even funnel, you're getting customers and leads for free.
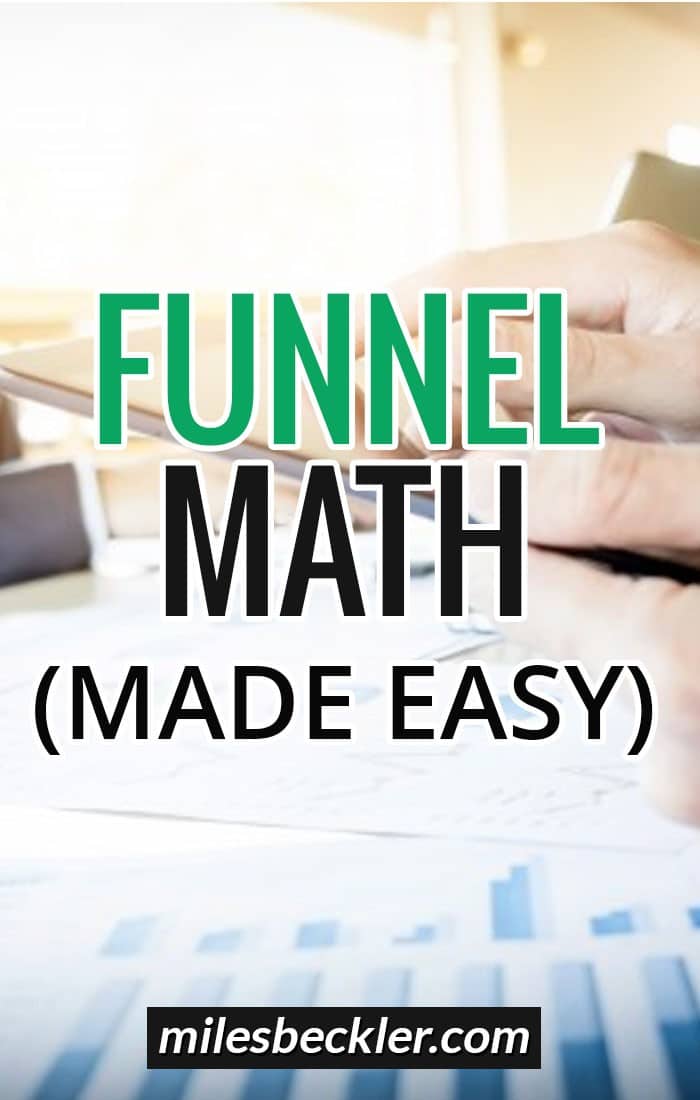
A few days ago, I set up a new opt-in funnel. It's really simple. After potential customers opt-in for a free item they get a product offer. The retail price on the product is $97. I’m offering it to them for $27.
If they’re interested, they check-out. That transaction remains open and they get a one-time offer for another course. This one is a $77 course for another $27. Customers either click yes or no and depending on that, they pick up what they purchased.
How Is the Funnel Working?
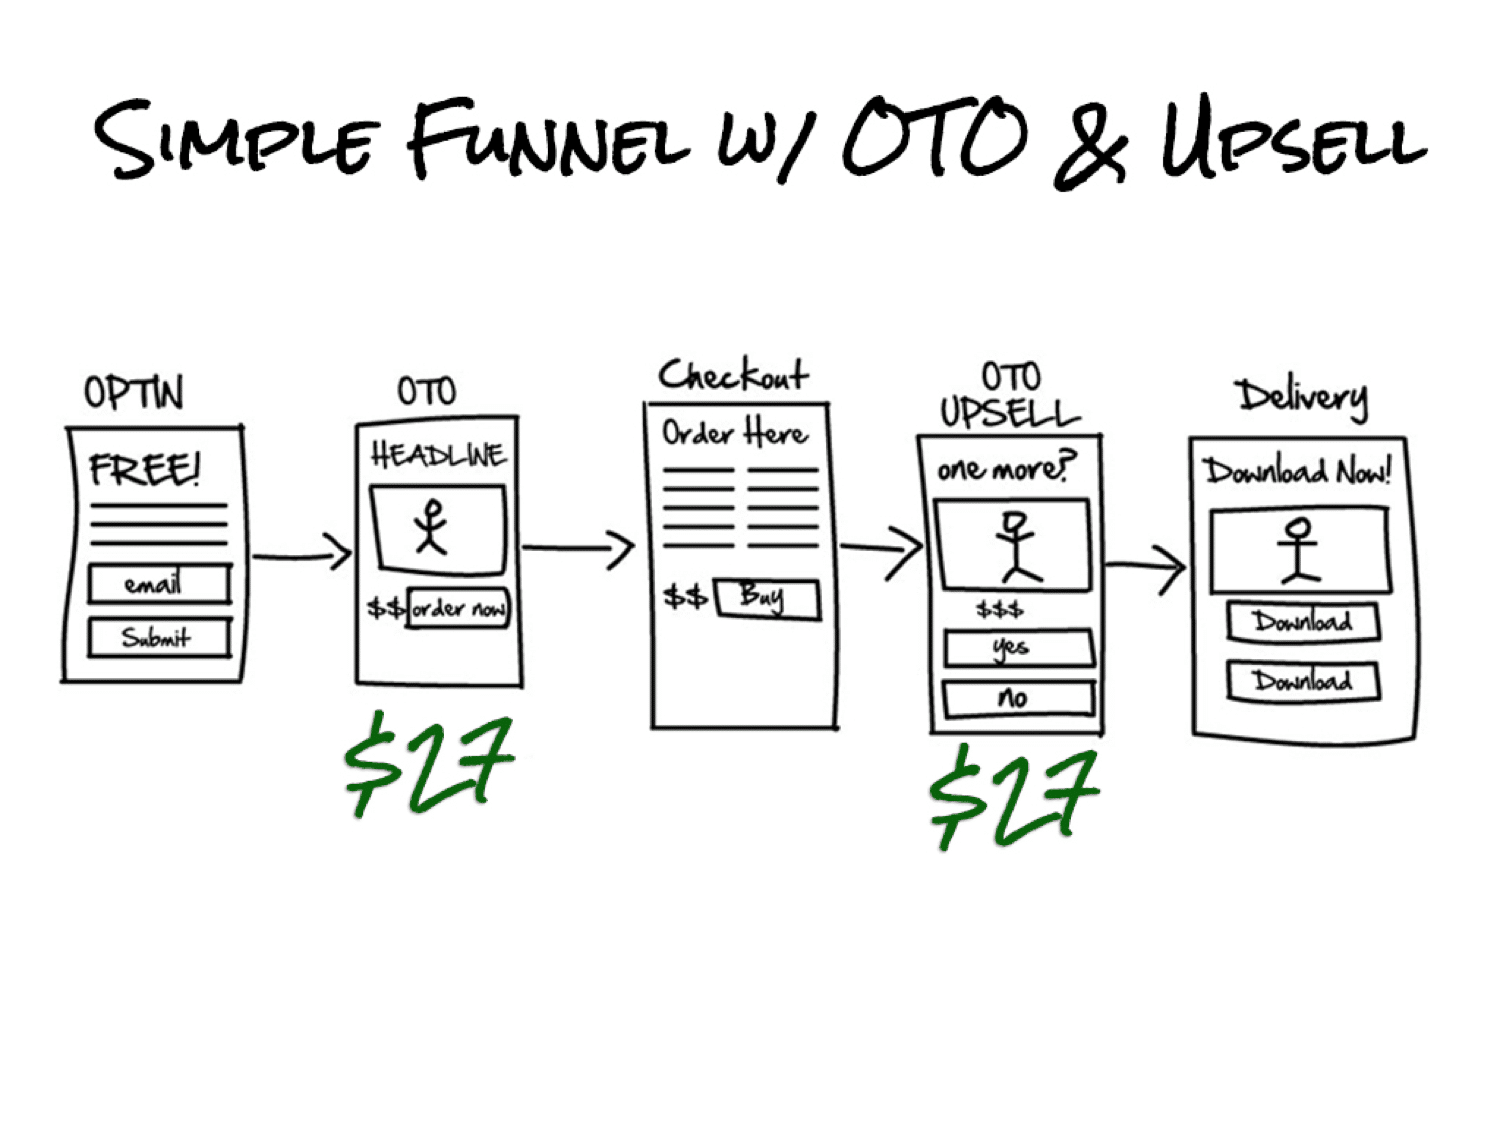
To find out, we need to calculate. What I've noticed in running this funnel (with well over 1000 people coming through) is that I'm getting a 50 percent conversion rate on my second offer.
They're both $27, so what I'm looking for first is my average order value. Keep in mind that this is just for this funnel and I'm only talking about this front-end order. If I've got a $27 one-time offer and 50 percent of these people are purchasing another one, what is the average order value?
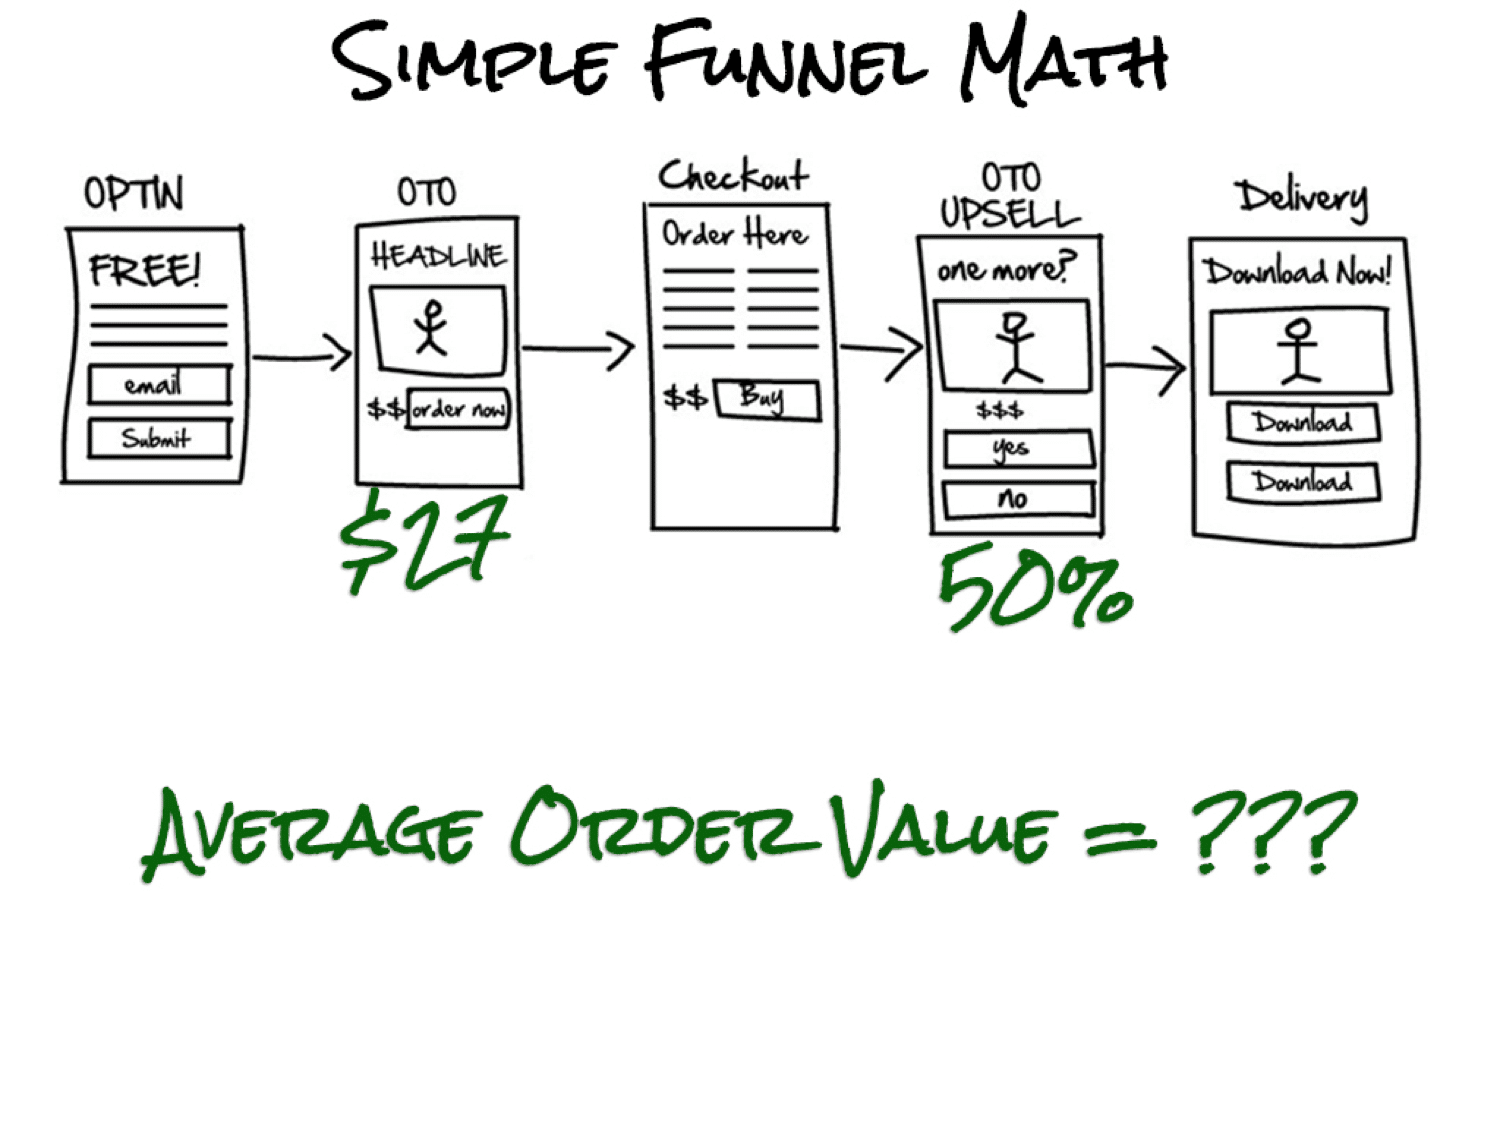
And here's how you calculate it.
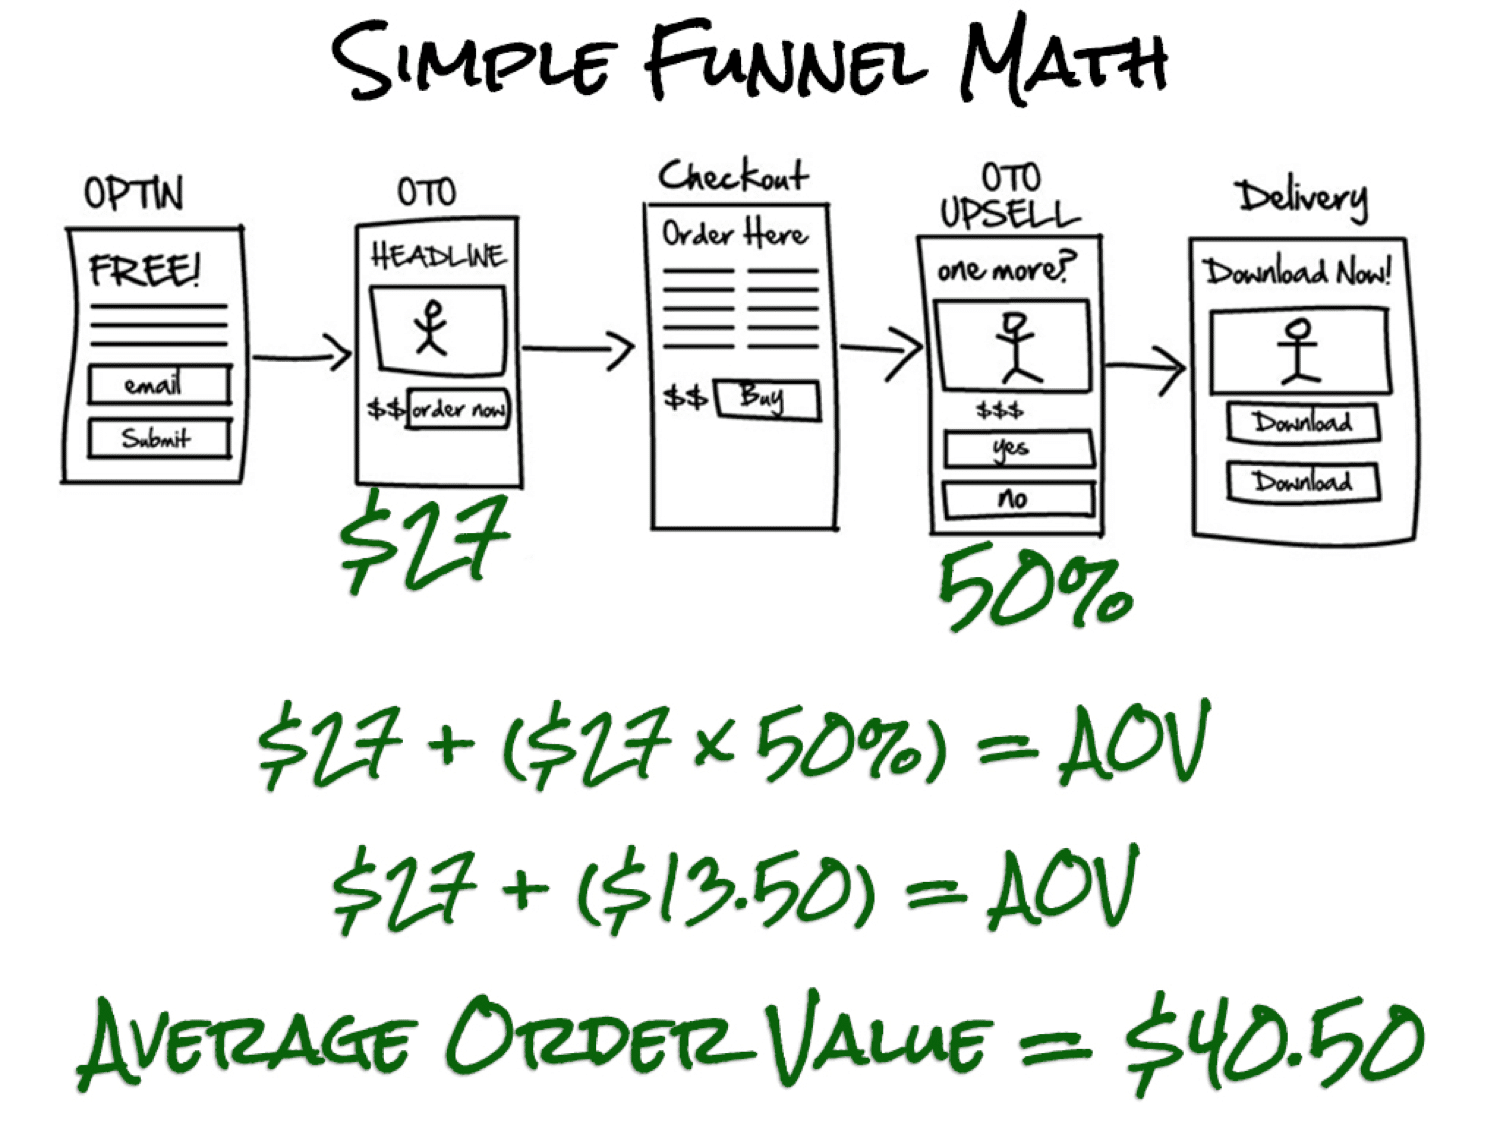
I'm going to make $40.50 every time someone checks out. Because every other person is going to take me up on this, it’s a bump in $13.15 per average order.
Now that I know my average order value, I move on to the next step.
My first one-time offer is converting at two percent which means that two percent of the people who opt-in and see my OTO are purchasing. I want to figure out how many subscribers I need to get one customer.
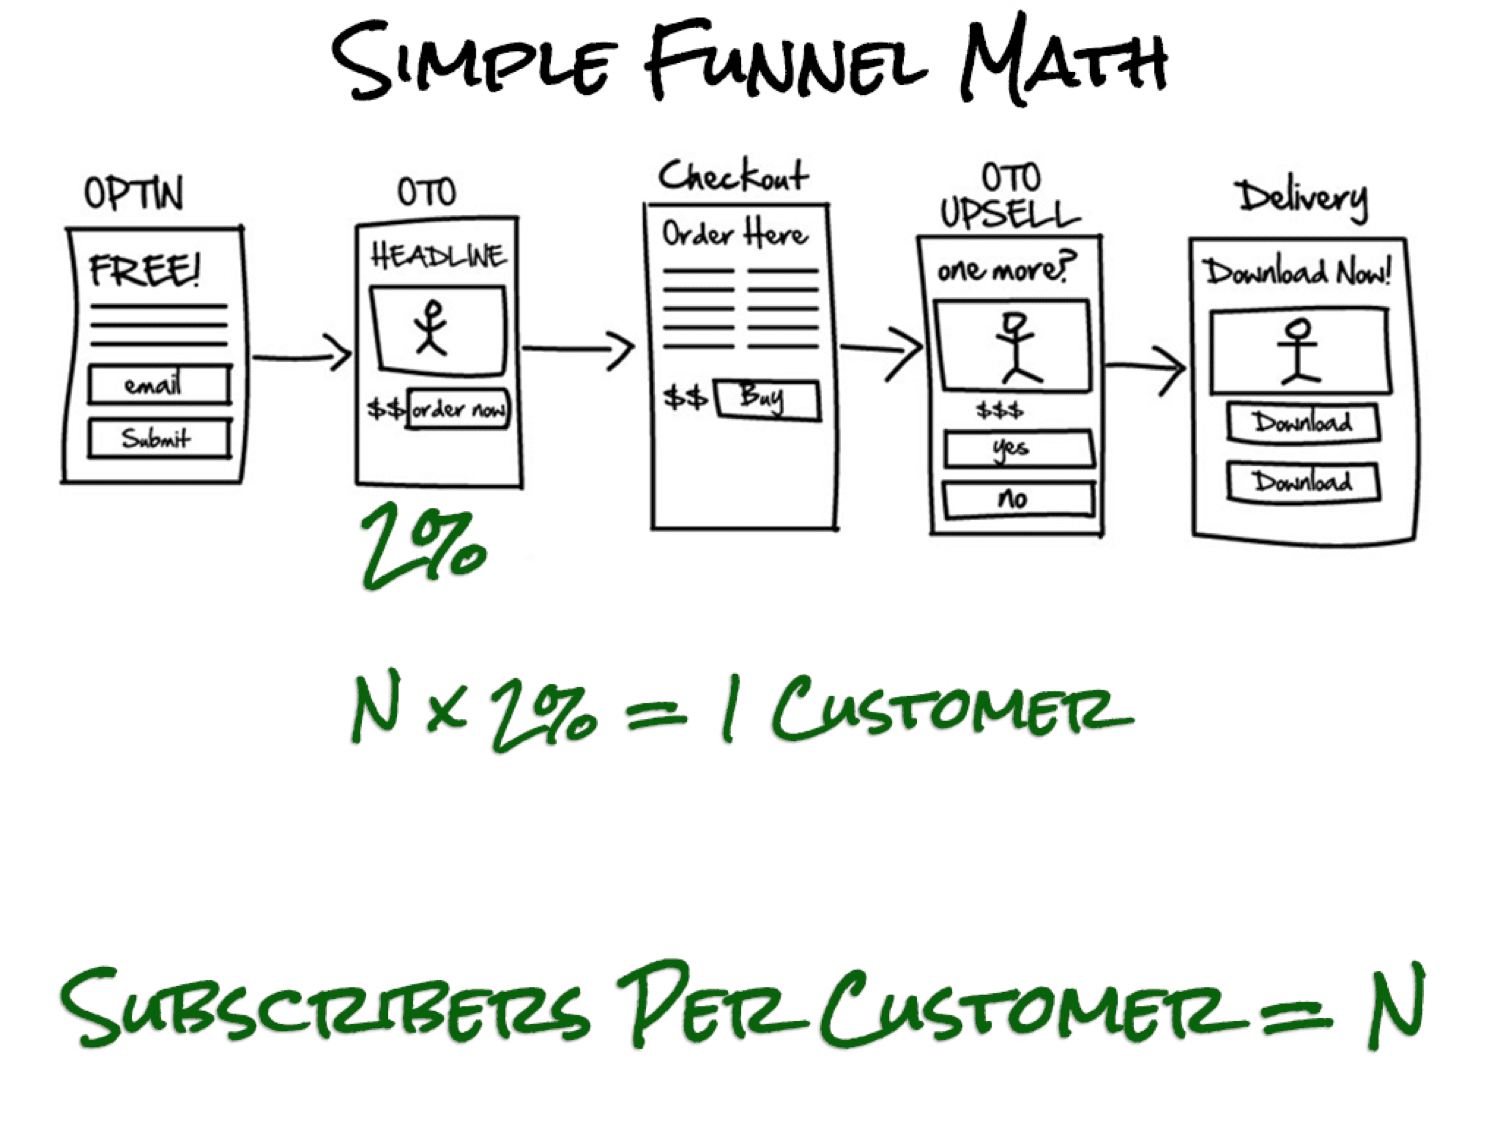
- ‘N’ is the number of subscribers required
- Two percent is my conversion rate (.02 on a calculator)
- Multiply by two to equal one customer
Divide the number of customers (one) by my conversion rate. In this case, it's 50.
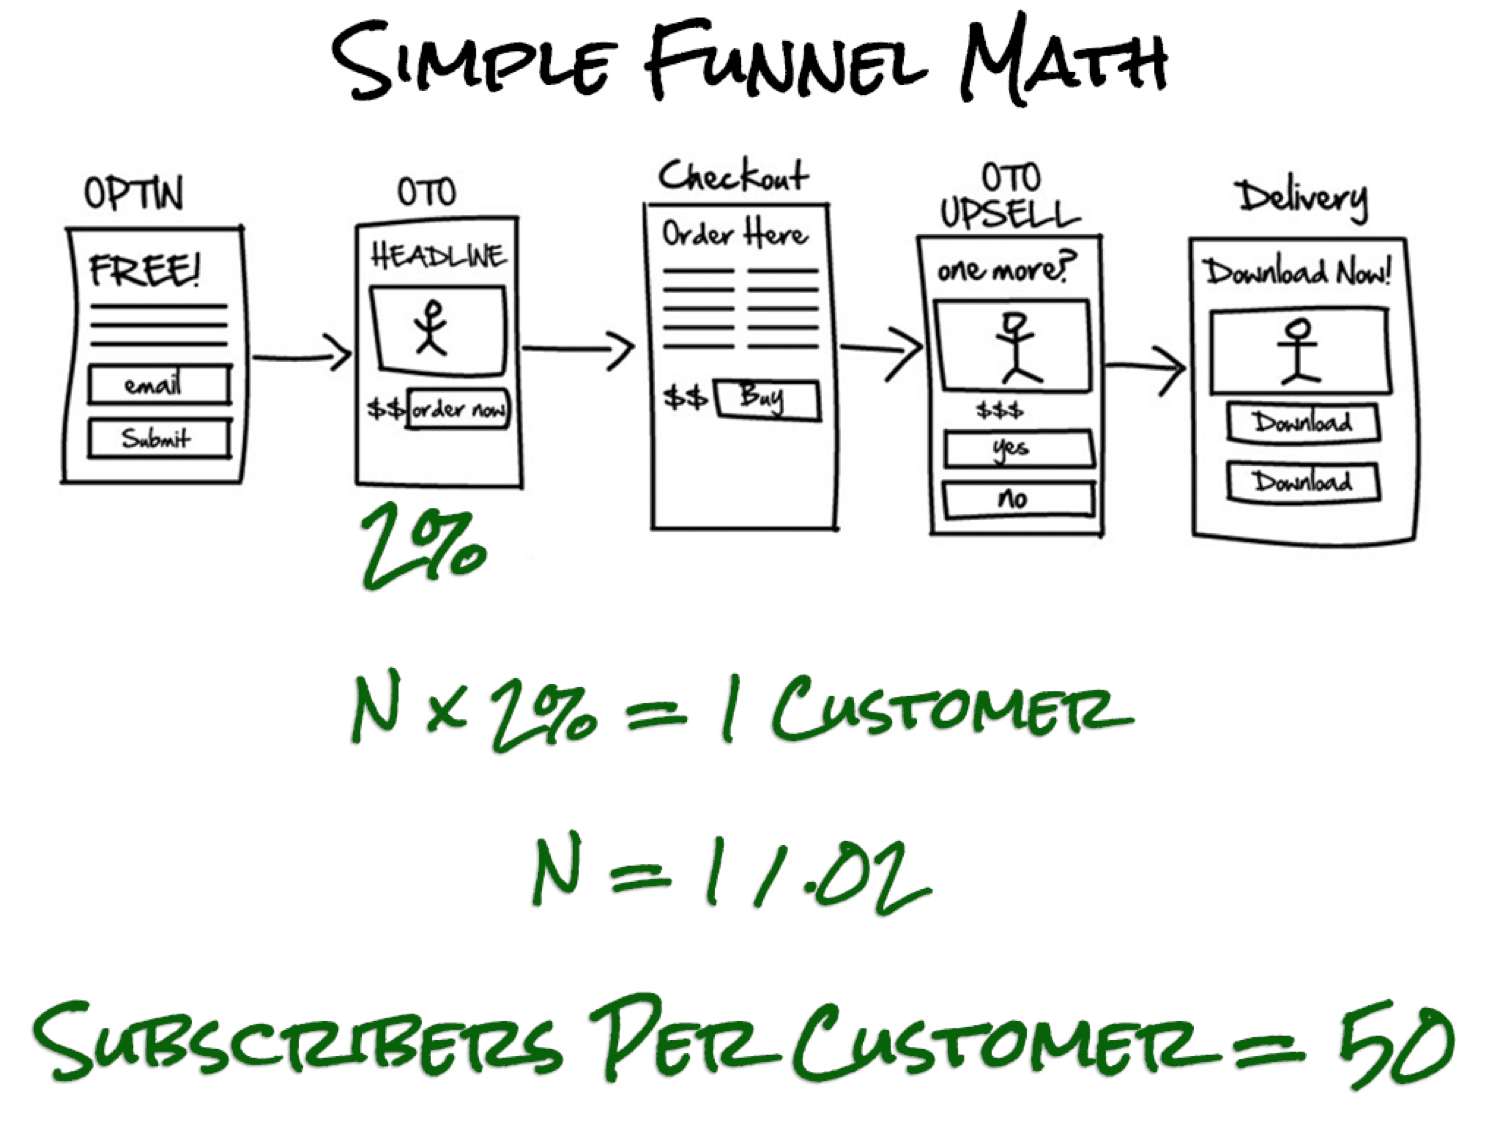
Now that I have this piece of information, I can go to the next level. This is where we actually get to put the numbers together.
Every time I get 50 opt-ins, on average I'm seeing one person purchase. That's my two percent conversion rate and it’s worth an average of $40.50.
What Is My Break-Even Point?
Take the average order value ($40.50) and divide it by the number of subscribers required to get one order (50). In this example, I get .81 cents. That's my break-even point.
If I'm getting subscribers for .81 cents each or less, I'm good. That means I can put in $100 a day and get $100 out. I can put in a thousand dollars a day and get a thousand dollars out.
The by-product is a massive number of subscribers and customers.
Compare this Number with Your Campaign Performance
Within your Facebook Ads campaign interface, you’ll be able to see your cost per conversion. This is your cost per email subscriber.
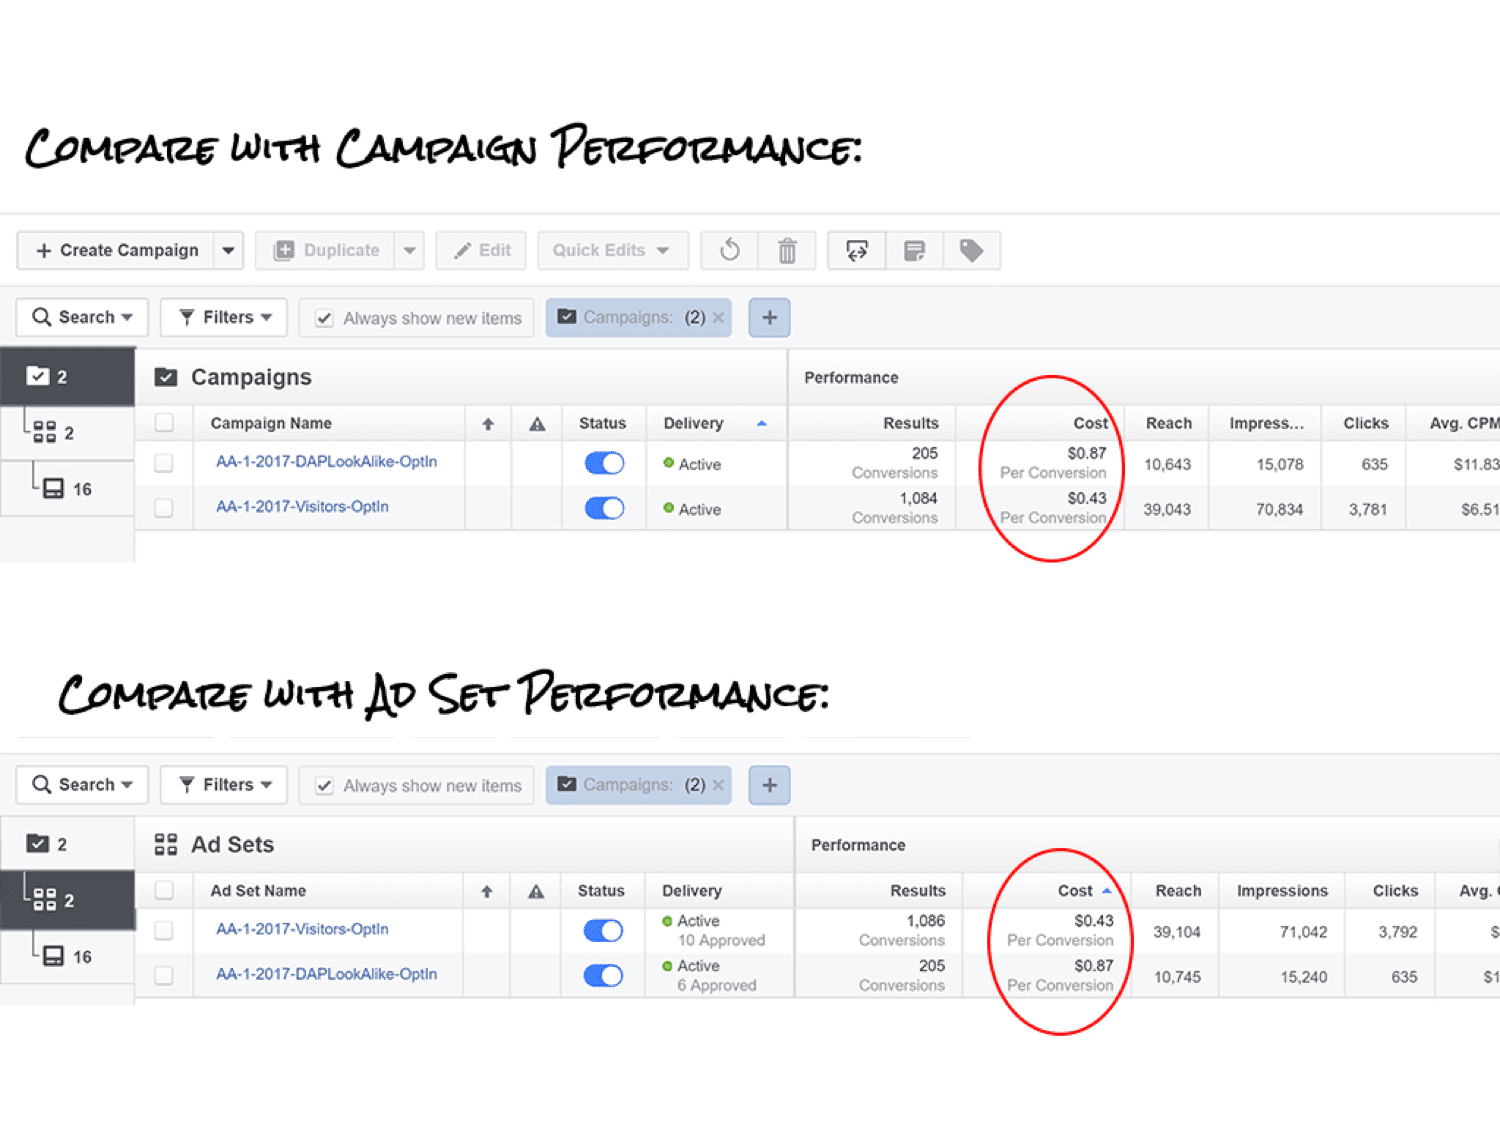
I started running a visitor's opt-in to retarget my audience. I've had over a thousand subscribers come in and it's cost me 43 cents per subscriber. Well within my KPI’s. On another campaign, you can see I've got 200 coming through and it's .87 cents per conversion which means I'm losing six cents per subscriber right now.
And so that's mirrored here in the ad set level. If you had three or four ads sets per campaign you would see more of them here and you'd be able to look at which ad set is giving you your KPI.
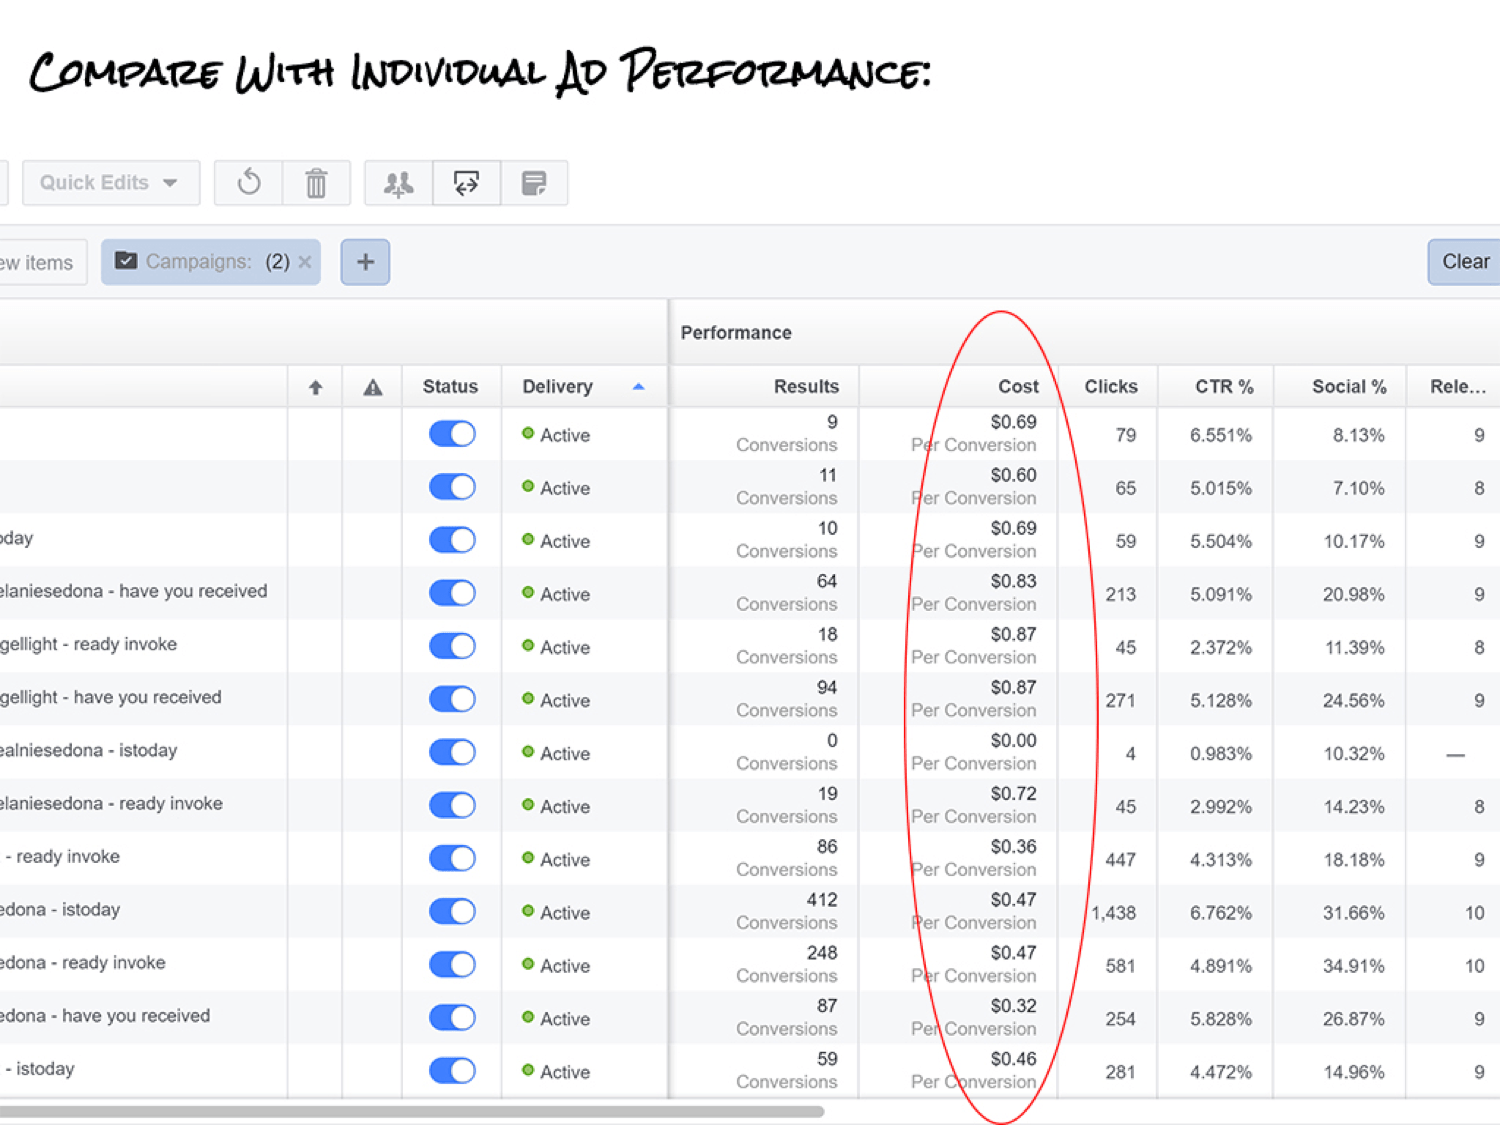
The circled column is my cost per conversion. I can look at it line by line, ad by ad. You can see I have one ad that is .69 cents for conversion. That's good.
What's really cool is this one that has 412 conversions. That's 412 subscribers at an average of .47 cents each. There’s also an ad with 248 subscribers at an average of .47 cents each and another at .32 cents per subscriber. That's absolutely a brilliant number.
Relevant Score
I want to point out my relevant score. They are very high – eights, nines, and tens. This is why I'm getting a good result.
Facebook sees my ad as being highly relevant to my audience and they see my ad as being highly relevant to the content I'm sending them to. I get a good relevant score which means I get a nice low-cost click cost and cost per conversion.
Knowing Your Math Will Set You Free
If you feel like you didn't get all of the math or you want help with it, watch the video below.
Take notes! Knowing your math and your numbers is what ultimately will set you free. That is how you win - with statistical probability. The campaigns in my example are still new. I'm monitoring these numbers very closely as I get to that ten thousand subscriber mark.
Rely on The Data
If I see ten thousand subscribers coming in at an average of .40 or .50 cents per subscriber, and my break-even point is .81 cents per subscriber, I know that I'm net profitable on the front end. Plus everything I make down on the back end of my funnel!
And as you know, if you’ve been watching me for a while, the back end of the funnel is where you make your money. Pros focus on the back end of the funnel, rookies focus on the front end.
I’ve got to focus on the front end here because I'm turning on the lead machine. I'm bringing in a thousand leads a day from Facebook pay per click ads and I'm going to ride this as long as my KPI’s stay within my operating range.
Refine, Refine, Refine
I'm running split tests on my advertisements already to keep refining the wording. What are those phrases that get my target market to take action? And also, what are the other target markets that I can go after through lookalike audiences and the interests.
This way, I can actually expand my audience and can keep marketing at this aggressive pace for a long period of time. This is the game. Broken out in numbers and super simple.
